
Overhung Out to Dry?
How Overhang Seats Undermine Democratic Legitimacy in NZ Parliament
Dr. John Baldridge
PhD Geography
“I think we’re going to have to reassess the electoral system.”
–National Party senior MP Chris Bishop, commenting on the
2026 overhang seat results on RNZ
I’m a recent migrant to Aotearoa New Zealand from the United States, and I’ve been watching my first NZ election with great fascination. I am also a social science academic with a keen interest in how political institutions enable, constrain, and otherwise shape the expression of power. The US Senate has become a famous example of disproportional representation in an ostensibly democratic system, to the extent that political scholars question its political legitimacy (e.g. Drutman 2024). With the results of NZ’s 2026 election, it has become clear that the MMP mechanism for “overhang seats” threatens to cause a similar problem. Intended or not, the next sitting Parliament will convene with significant imbalances in democratic representation, accruing to the benefit of a minority of voters.
Fundamentals
To begin my analysis, I submit a few basic premises, from which it proceeds. First, a national representative body should reflect the will of the national electorate overall. Second, insofar as each MP gets one vote in Parliament, each MP should represent roughly the same number of voters. The general idea is that if, say 20% of voters like the Banana Party’s policy package and vote for it, then 20% of the representative vote in Parliament should line up with the Bananas. If, for example, there were 100 seats in Parliament, the BP should have 20 MPs voting for them. The question of whether to accept or reject these fundamentals will be addressed further below, but these premises are widely accepted as basic democratic principles in political philosophy (CITE).
MMP and Democratic Principles
MMP strives towards these goals by way of the Party Vote: this vote expresses the national will in terms of policy, using political parties as policy proxies. Indeed, one of the strongest rationales for adopting MMP was to create a Parliament that more faithfully represented the national political sentiment. (REFERENCES)
The system as adopted, however, contains an internal contradiction in democratic principles, expressed very clearly by the “overhang” provision. First, let’s run the numbers, which make the nature of the problem strikingly clear. Table 1 shows the preliminary figures released immediately after the initial count was complete, excluding special ballots. Parties winning no seats in Parliament have been excluded for clarity.
| Party | Party Votes | Party Vote % | Adj.%* | Electorate Seats | List Seats | Total Seats | % Seats in Parliament | Voters per MP | Overhang Seats |
| NAT | 706680 | 29.21 | 29.47 | 42 | – | 42 | 32.06% | 16,826 | 6 |
| LAB | 710330 | 29.36 | 29.62 | 21 | 15 | 36 | 27.48% | 19,731 | – |
| GRN | 321902 | 13.3 | 13.42 | 2 | 14 | 16 | 12.21% | 20,119 | – |
| ACT | 264121 | 10.92 | 11.02 | 1 | 12 | 13 | 9.92% | 20,317 | – |
| NZF | 236630 | 9.78 | 9.87 | – | 12 | 12 | 9.16% | 19,719 | – |
| TOP | 144298 | 5.96 | 6.02 | – | 7 | 7 | 5.34% | 20,614 | – |
| TPM | 13845 | 0.57 | 0.58 | 5 | – | 5 | 3.82% | 2,769 | 5 |
| TOTAL | 2397806 | 99.1 | 100 | 71 | 60 | 131 | 100 | 11 |
Table 1: 2026 Preliminary Results
*see discussion for details
Most columns in Table 1 are self explanatory. Column 3 (Adj. %), Column 7 (% Seats), and Column 8 (Voters per MP) deserve more elaboration.
Column 3 shows the Adjusted Percentage of party vote after removing parties that failed to gain any seats. This is calculated by counting only the party votes that went to parties entering Parliament and determining the portion of that total number of votes assigned to each parliamentary party. This is a fair adjustment because it accurately represents the percentage of total votes received among all parties that will have seats in the next term.
Column 7 shows the actual percentage of seats assigned to each party entering the parliament, based on the “overhang” rule.
Column 8 divides the number of seats a party received in Parliament by the total votes cast for that party in the election. This shows the actual number of party voters represented by each MP.
Two outliers are immediately observable: The National Party and Te Pāti Māori. It is no coincidence that these two parties also received a relatively large number of overhang seats. Let’s consider what this means from a few different angles.
Uneven Representation
The most damning outcome for our version of MMP comes in the form of grossly uneven representation in Parliament. With the overhang, some MPs represent far fewer party voters than others. That means those party voters get to exercise substantially more power in government than other voters.
From the chart, we can see that each National Party MP represents about 17,000 National Party Voters, but all other parties needed about 20,000 votes to score an MP (except for TPM, and we’ll get to them in a moment). Another way to put this is that each National MP only represents 85% of the voters that other party MPs represent, yet they cast the same single votes in Parliament. Figure 1 provides a visual illustration.
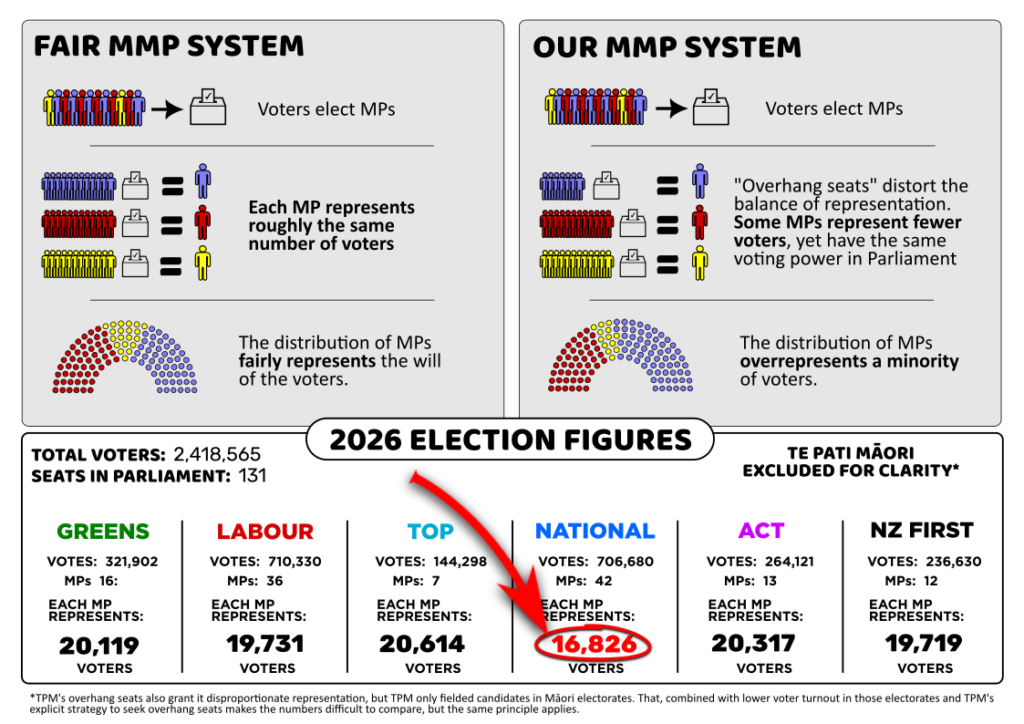
Figure 1: Uneven Representation Infographic
Yet another way to consider this imbalance is to realise that, in terms of voter power expressed in raw numbers, for every 7 MPs the non-overhang parties get, National gets an extra 8th MP. Essentially, each National Party Voter’s expressed power is 15% higher than that of other party voters. It would be hard to argue that this is a fair outcome (though see the discussion below).
Te Pāti Māori’s overhang seats produce an even more pronounced imbalance in representation. The extremity of the imbalance in TPM’s case derives mainly from the very successful vote-splitting campaign on their part, along with significantly lower turnout on average in the Māori electorates. Regardless, the same dynamic applies: each MP that TPM sends to the next parliament will represent only 2800 party voters, yet have the same voting power as Green MP representing 20,000 party voters.
Distortion of Nationwide Political Opinion
Predictably, the uneven representation of voters by MPs leads to an obvious gap between the national political will as expressed through party policy support and the actual makeup of party representation in Parliament. Indeed, this possibility was recognised during debates over adoption of MMP in the 80s and 90s (CITE). Insofar as the national parliament serves as the decision making body for the entire country’s policies, a strong argument can be made that it should represent the collective political sentiment as accurately as possible via representative democratic methods. Here, we can see clear evidence that the current MMP system falls short in accurately representing the distribution of nationwide political opinion.
The numbers do not lie. Referring again to Table 1, we can compare the Adjusted % column with the % Seats column to see the discrepancy between the actual public will with regard to party representation in Parliament and the percentage of parliamentary seats allotted. It is worth a closer look:
| Party | Adjusted Party Vote %* | % Seats in Parliament | Skew in Party Representation | Voters per MP | Overhang Seats |
| NAT | 29.47% | 32.06% | +2.59% | 16,826 | 6 |
| LAB | 29.62% | 27.48% | -2.14% | 19,731 | – |
| GRN | 13.42% | 12.21% | -1.21% | 20,119 | – |
| ACT | 11.02% | 9.92% | -1.09% | 20,317 | – |
| NZF | 9.87% | 9.16% | -0.71% | 19,719 | – |
| TOP | 6.02% | 5.34% | -0.67% | 20,614 | – |
| TPM | 0.58% | 3.82% | +3.24% | 2,769 | 5 |
Table 1.1: Amount of Distortion in Party Representation
Not only did the parties with overhang seats claim a higher percentage of seats than the party vote demanded, but all other parties suffered a corresponding negative skew in representative seats. Thus, when we consider the relative difference between the nation’s party preferences and their actual representation in Parliament, the distortion appears even more pronounced. Consider Figure 2:
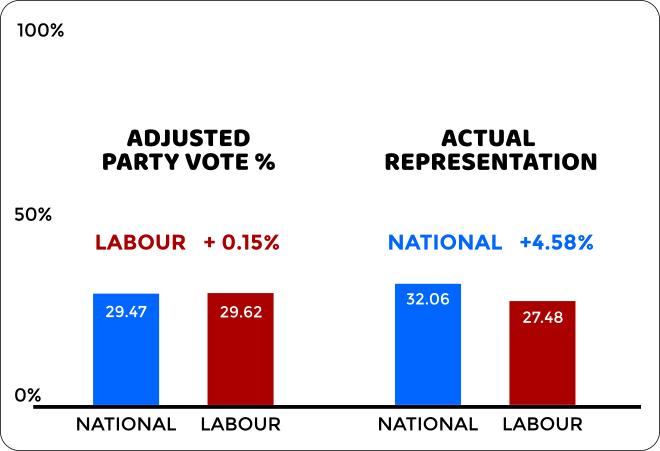
Figure 2: Exacerbated Gap in Accurate Representation
Where the poll of the public’s political will showed a dead heat between National and Labour for largest party in Parliament–with a slight edge to Labour–the actual representation by seats gives National an advantage of more than 4.5 points. Few could argue seriously that this amounts to a fair representation of national voter preference in the country’s sole countrywide deliberative governing body, though some will no doubt try.
Undermined Legitimacy
These figures paint a grim picture when it comes to earned trust in public institutions. Anecdotally, I’ve heard voters express dismay that they don’t fully understand the overhang system–and certainly didn’t expect the party vote to be so marginalised in this election. Indeed, few members of the voting public could have grasped the full implications of the overhang provision back in 1996, when MMP was first enacted into practice.
When people experience a gap between what they believe has been promised and what they actually receive, they tend to question the legitimacy of the promise. Anyone in the New Zealand electorate who believed MMP would fairly represent the national policy sentiment via the party vote mechanism has likely been dealt a disillusioning blow. For them, a crisis of legitimacy may be at hand.
The more members of the electorate see the electoral system as less than legitimate, the more likely they are to stop participating. Unchecked, this could lead to a downward spiral in which low participation rates further undermine legitimacy, and political cynicism grows. A healthy democracy requires fair institutions that inspire trust. This kind of unexpected uneven and distorted representation has already begun to erode trust in MMP as an institution, as evidenced by Mr. Bishop’s quote at the start of this article. As a nation, we would be wise to address this problem before it grows worse.
An Embedded Contradiction
Beneath the numbers and bureaucratic structures of MMP lies a contradiction in political philosophies, written into the very rulebook of New Zealand’s elections.
A Reassessment
Comments are closed, but trackbacks and pingbacks are open.